To know whether your DAX query is running as efficiently as possible, it is necessary to know what happens under the hood when you execute one. Luckily for us, DAX Studio exists!
DAX Studio (link at the bottom) is a powerful tool used for analysing and optimizing DAX queries in Power BI and Analysis Services models. One of its key features is its ability to show what happens during query execution.
What Happens When You Fire Off a DAX Query?
There are two parts to the DAX engine, the Formula Engine, which is the brains of the operation, takes a DAX query and turns it into a simple set of instructions for the Storage Engine to execute. The Storage Engine does the heavy lifting, sequentially running these tasks and returning the relevant data to the Formula Engine.
How Do We See This in Action?
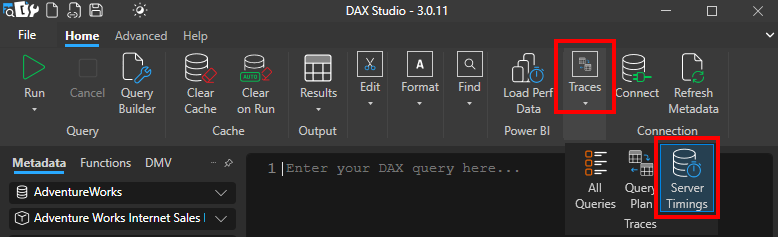
As I mentioned earlier, DAX Studio has a couple of features to spy on queries as they run. One of which is the Server Timings feature which can be enabled by clicking Server Timings (Depending on your window size this may be inside the Traces menu)
Once you get a notification in the Log window at the bottom, it’s time to run a query. The below query is using everyone’s favourite imaginary online bicycle retailer’s dataset to fetch the count of all sales since 01/01/2010 that totalled more than $100 and display them per region.
Let’s run it:
DEFINE
MEASURE FactInternetSales[Count] =
CALCULATE (
DISTINCTCOUNT ( FactInternetSales[SalesOrderNumber] ),
FILTER (
FactInternetSales,
FactInternetSales[SalesAmount] > 100
&& FactInternetSales[OrderDateKey] > 20100101
)
)
EVALUATE
CALCULATETABLE (
SUMMARIZECOLUMNS (
DimGeography[EnglishCountryRegionName],
"Sales by Region", FactInternetSales[Count]
)
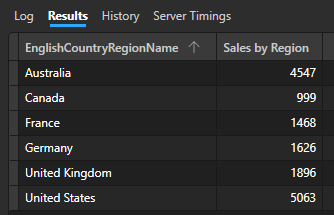
)Here is the result set:
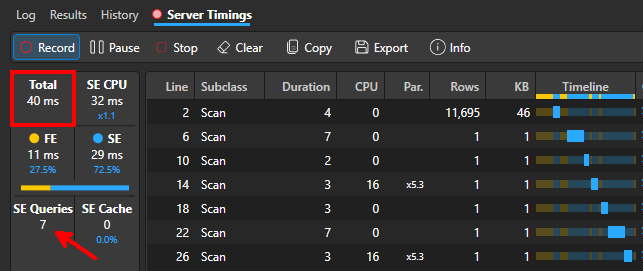
Here is the result of the server timing monitor:
What Does All of This Mean?
40ms seems very performant, however, you’ll notice I have pointed out that the Storage Engine ran 7 queries? This makes sense, 1 initial query to find the distinct regions and then 6 iterations of the main query using each of the regions to produce the displayed result set.
However, remember earlier on I mentioned the SE runs these commands sequentially? That means giving it 7 jobs to do requires 7 trips to the dataset to get what it needs. Can we perhaps write a better query to limit these trips?
Consider the below query:
DEFINE
    MEASURE FactInternetSales[Count] =
        CALCULATE (
            DISTINCTCOUNT ( FactInternetSales[SalesOrderNumber] ),
            FactInternetSales[SalesAmount],
            FactInternetSales[SalesAmount] > 100,
            FactInternetSales[OrderDateKey],
            FactInternetSales[OrderDateKey] > 20100101
        )

EVALUATE
CALCULATETABLE (
    SUMMARIZECOLUMNS (
        DimGeography[EnglishCountryRegionName],
        "Sales by Region", FactInternetSales[Count]
    )
)
Here is the result set, notice it is exactly the same as it was before:
Once again, let’s take a look at the server timing monitor:
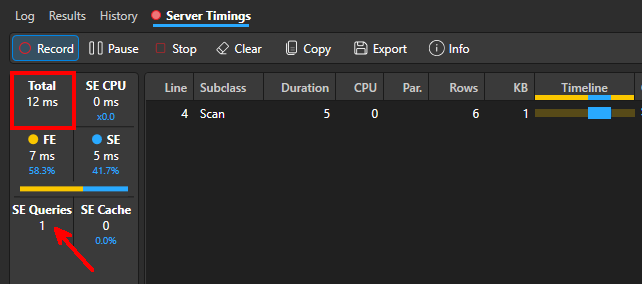
By removing the explicit filter on the second query you’ll notice that we’re only sending 1, albeit more complicated, query to the Storage Engine. You can also see that it ran in nearly a quarter of the original time, this example was a quick one to show the concept but apply the same concept to a Power BI page full of visuals firing multiple queries that take minutes to run, suddenly it becomes very important.
There is an explanation as to why the second query runs faster than the first but it involves diving into the engine’s inner workings and the DAX query plan, that’s a whole other post, maybe a part 2 at some point.
For now, download DAX Studio, throw your slow running queries at it to see where the workload is and see if you can’t use it to speed things up!
(DAX Studio can be downloaded here)

Leave a comment